How Charts Work: Understand and explain data with confidence :Understand and explain data with confidence
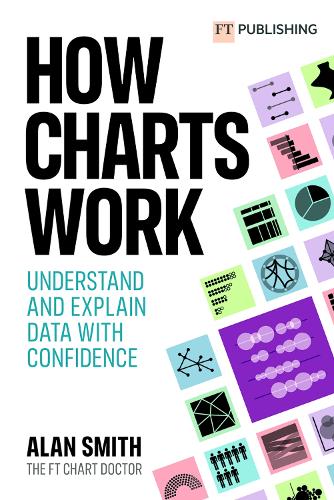
How Charts Work: Understand and explain data with confidence :Understand and explain data with confidence
paperback
Published:
12 October, 2022
Popular Books by Alan Smith
View All Books by Alan Smith


Description
Charts, graphs and tables are essential devices in business, but all too often they present information poorly. This book will help you:
Don't value design over information – present data persuasively.
Find the FT Chart Doctor's columns here - https://www.ft.com/chart-doctor
More Details
| Type | Book |
|---|---|
| ISBN13 | 9781292342795 |
| ISBN10 | 129234279X |
| Number Of Pages | 336 |
| Item Weight | 500 g |
| Product Dimensions | 156 x 234 x 23 mm |
| Publisher / Reseller | Pearson Education Limited |
| Format | paperback |
GoodReads Reviews
Author's Bio
Alan Smith is Head of Visual and Data Journalism at Financial Times. A data visualization specialist, he writes the FT’s popular “Chart Doctor” column. Alan is an experienced presenter, having lectured extensively on how to communicate with data. His TEDx talk, “Why you should love statistics,” was a TED.com featured talk in 2017. Previously, he worked at the UK’s Office for National Statistics, where he founded its award-winning Data Visualisation Centre. Alan received a BA in geography from the University of Lancaster and holds an MSc in GIS from Salford University. He was appointed Officer of the Order of the British Empire (OBE) in Queen Elizabeth II’s 2011 Birthday Honours list.